
Here are the headlines for the fifth week of the 2026 UK property market (week ending Sunday 8 February 2026).
I, together with Alice Bullard from Nested, analyse the market in the weekly UK Property Market Stats Show.
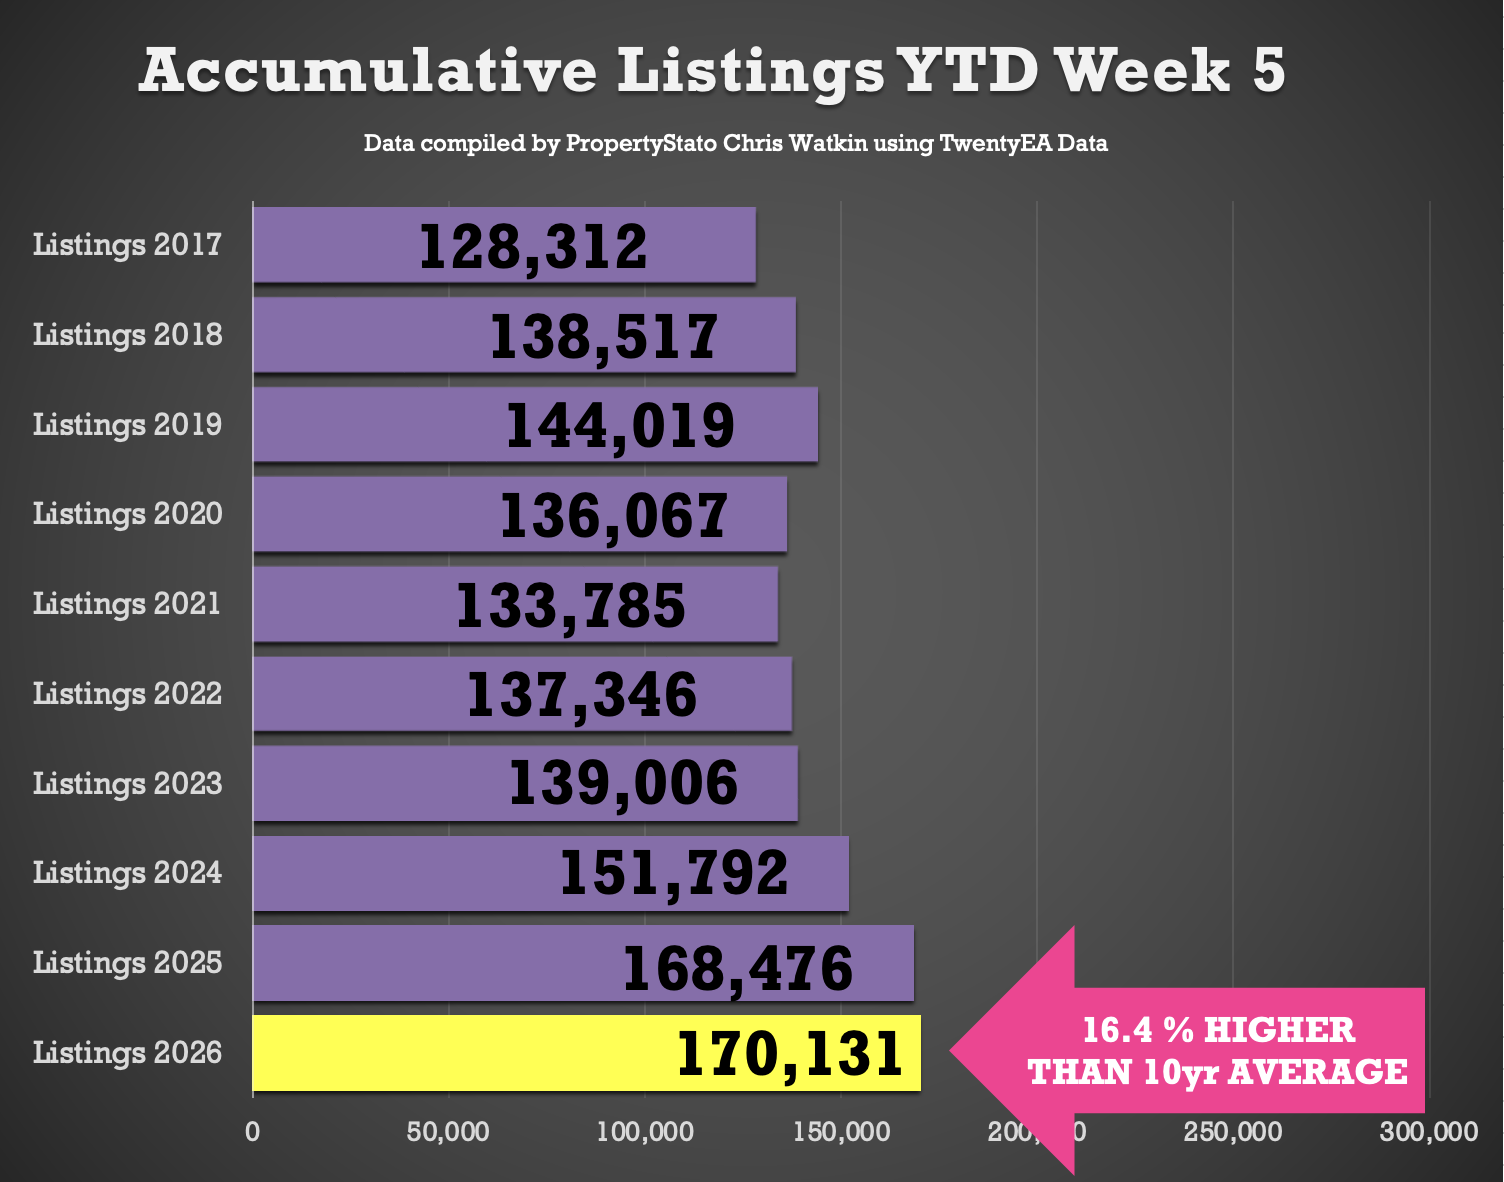
🟩 Listings – Strong
170k new properties have come onto the market YTD , 1% ahead of 2025, 12% above 2024, and 24% higher than the 2017–19 average.
🟩 GrossSales – Strong
114k UK homes sold STC YTD , 15% higher than 2024 and 23% above pre Covid norms.
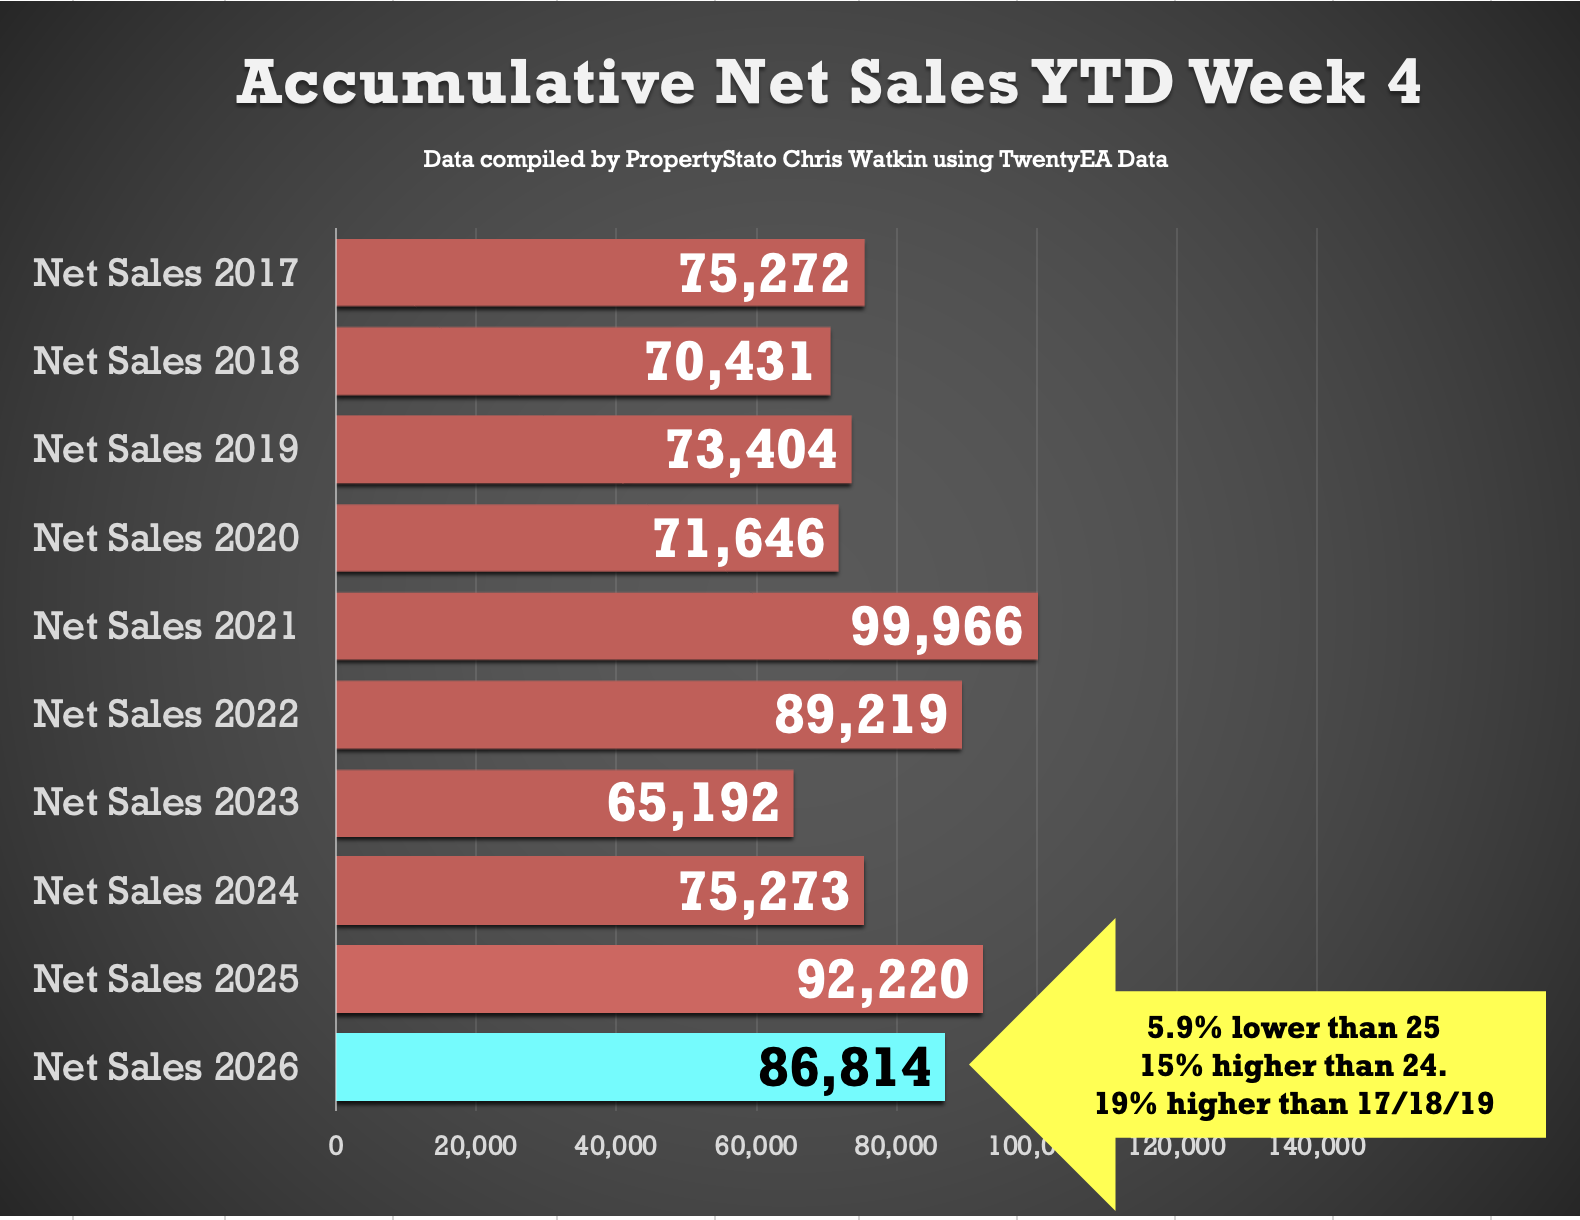
🟩Net Sales – Strong
87k UK net home sales YTD (Gross sales less Fall Thrus) running 15% ahead of 2024, 33% ahead of 2023 and 19% above the 2017–19 average.
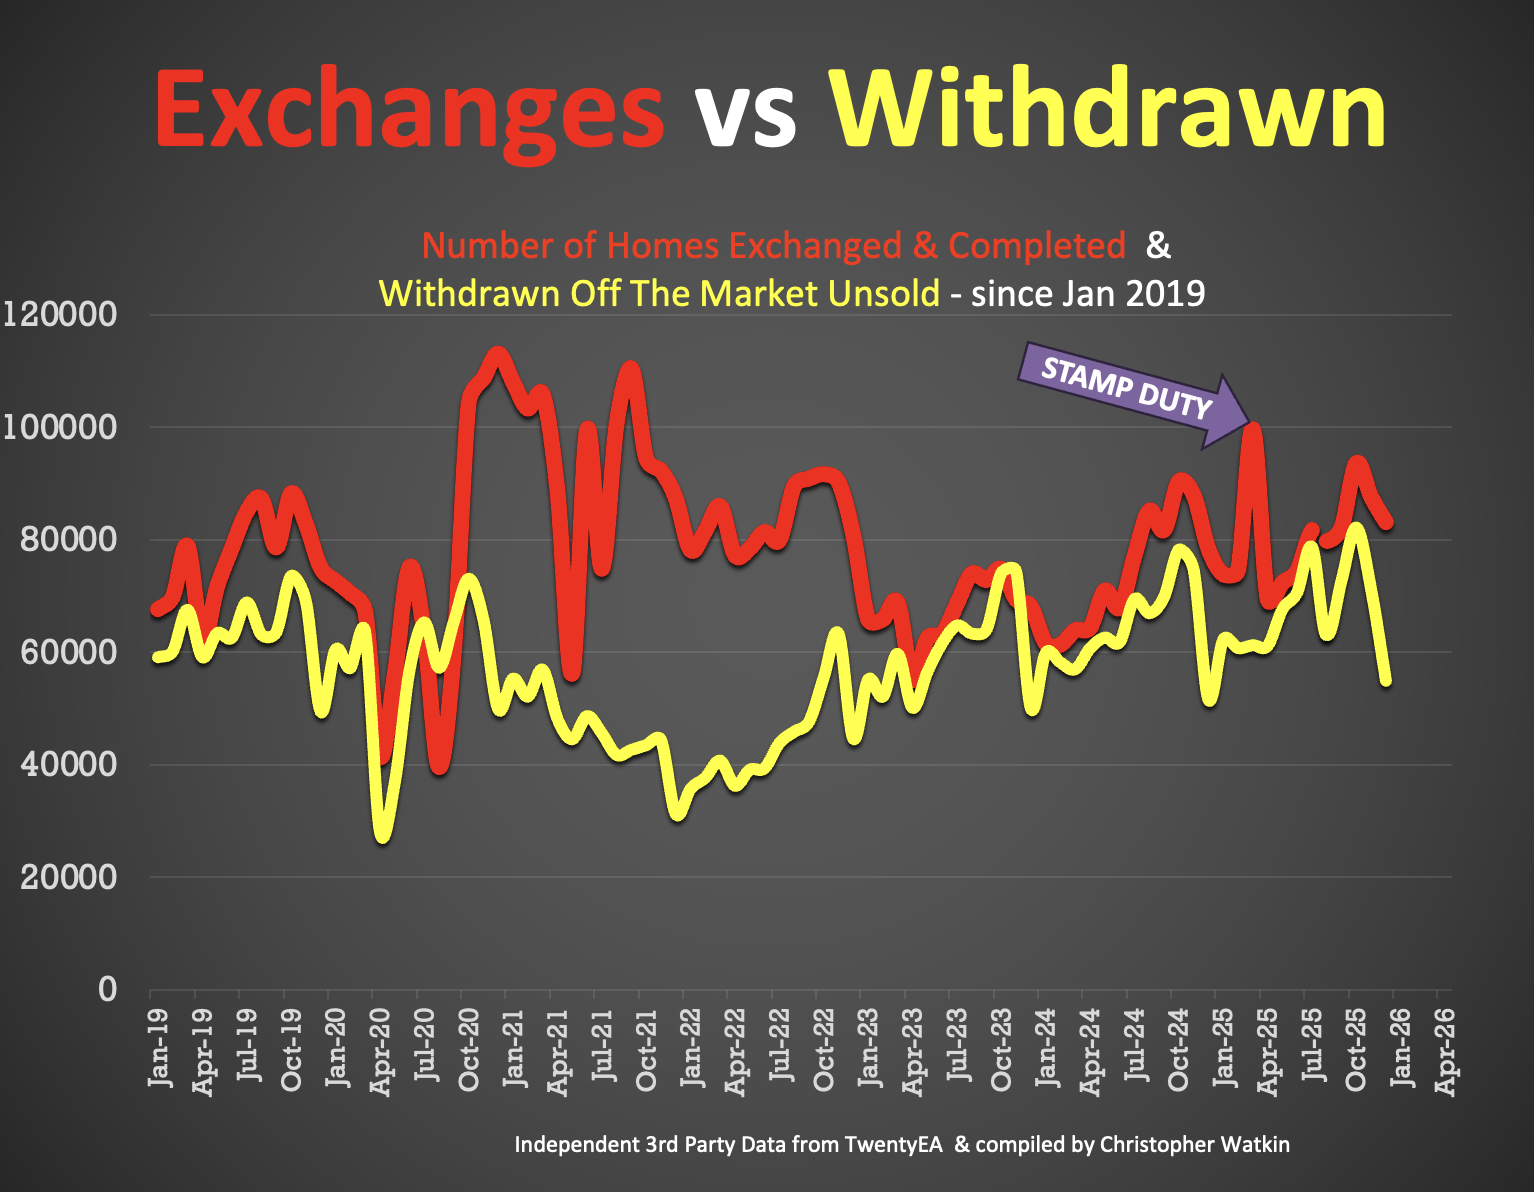
🟩Overvaluing – Awful
Some 47% of the homes that left UK Estate Agents books in January were withdrawn unsold. Main cause – blatant overvaluing supported by long sole agency agreements of 20+ weeks.
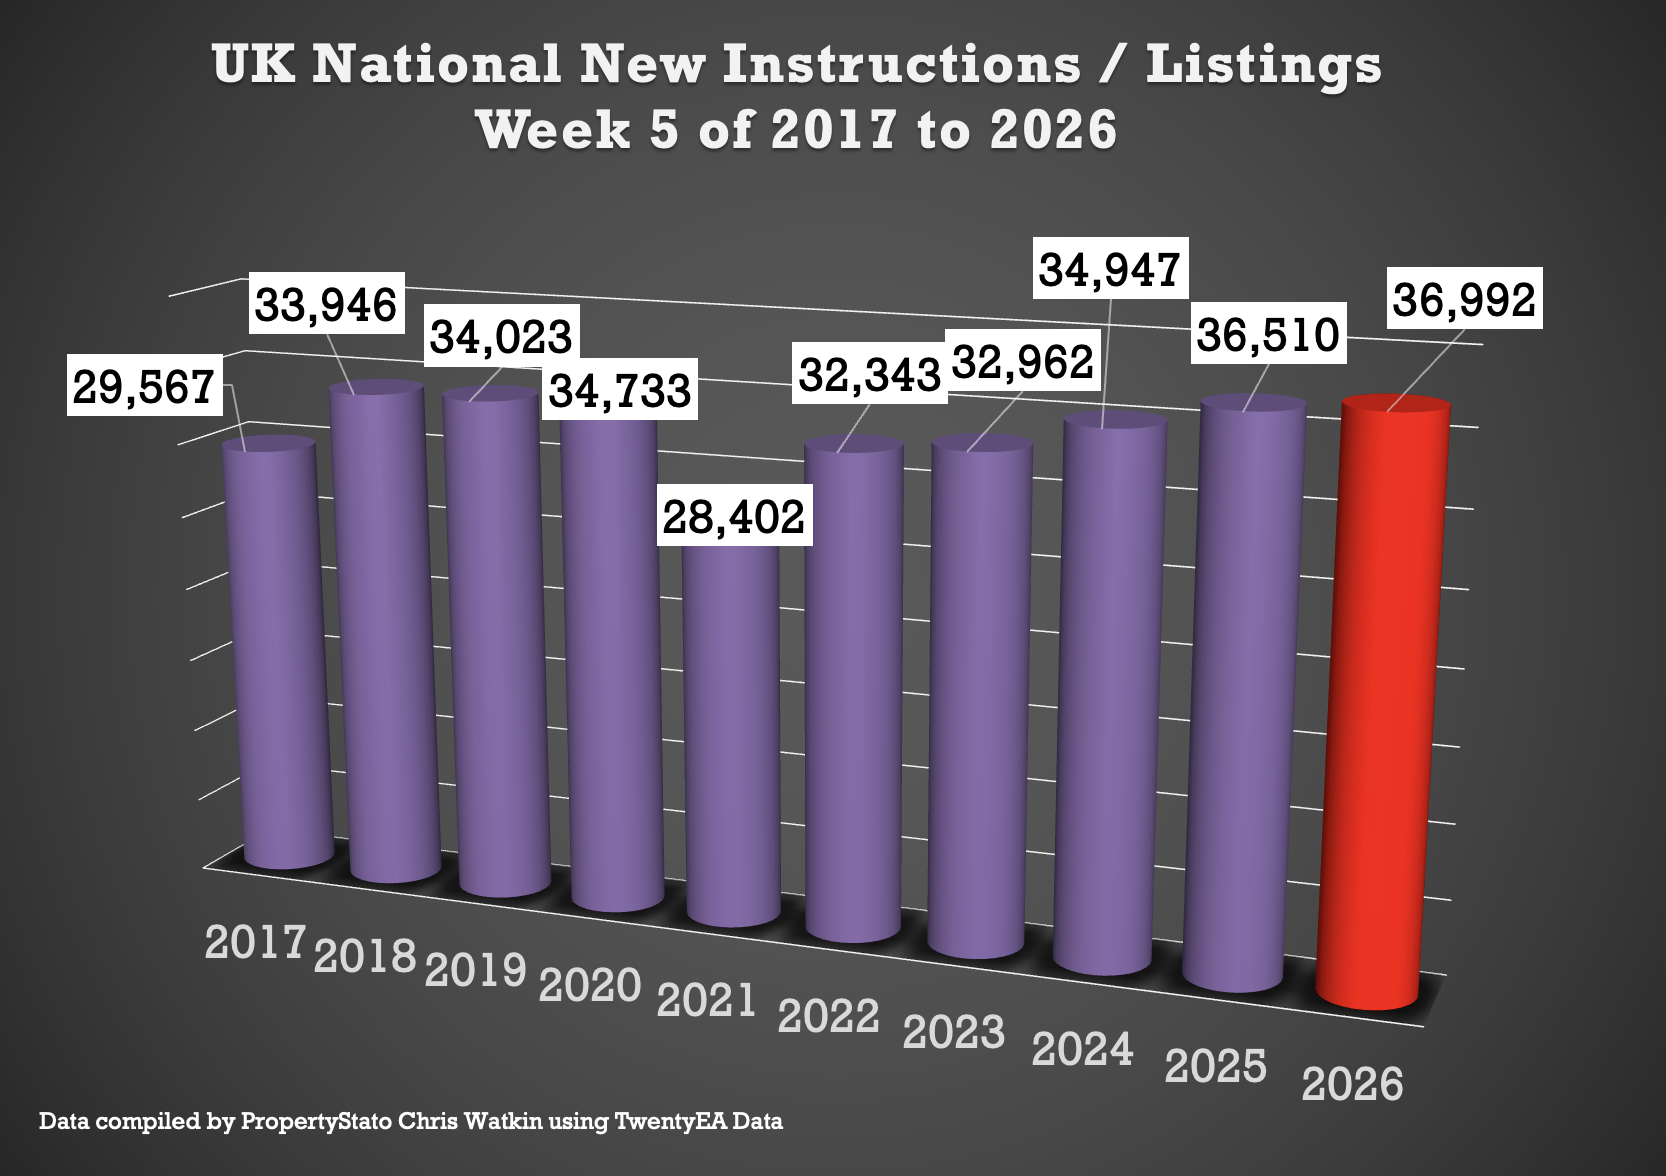
✅ New Listings
+ 36.9k new properties came onto market this week in week 5, up from 36.6k last week.
+ 2025 weekly average: 30.6k.
+ 10-year week 5 average : 33.4k.
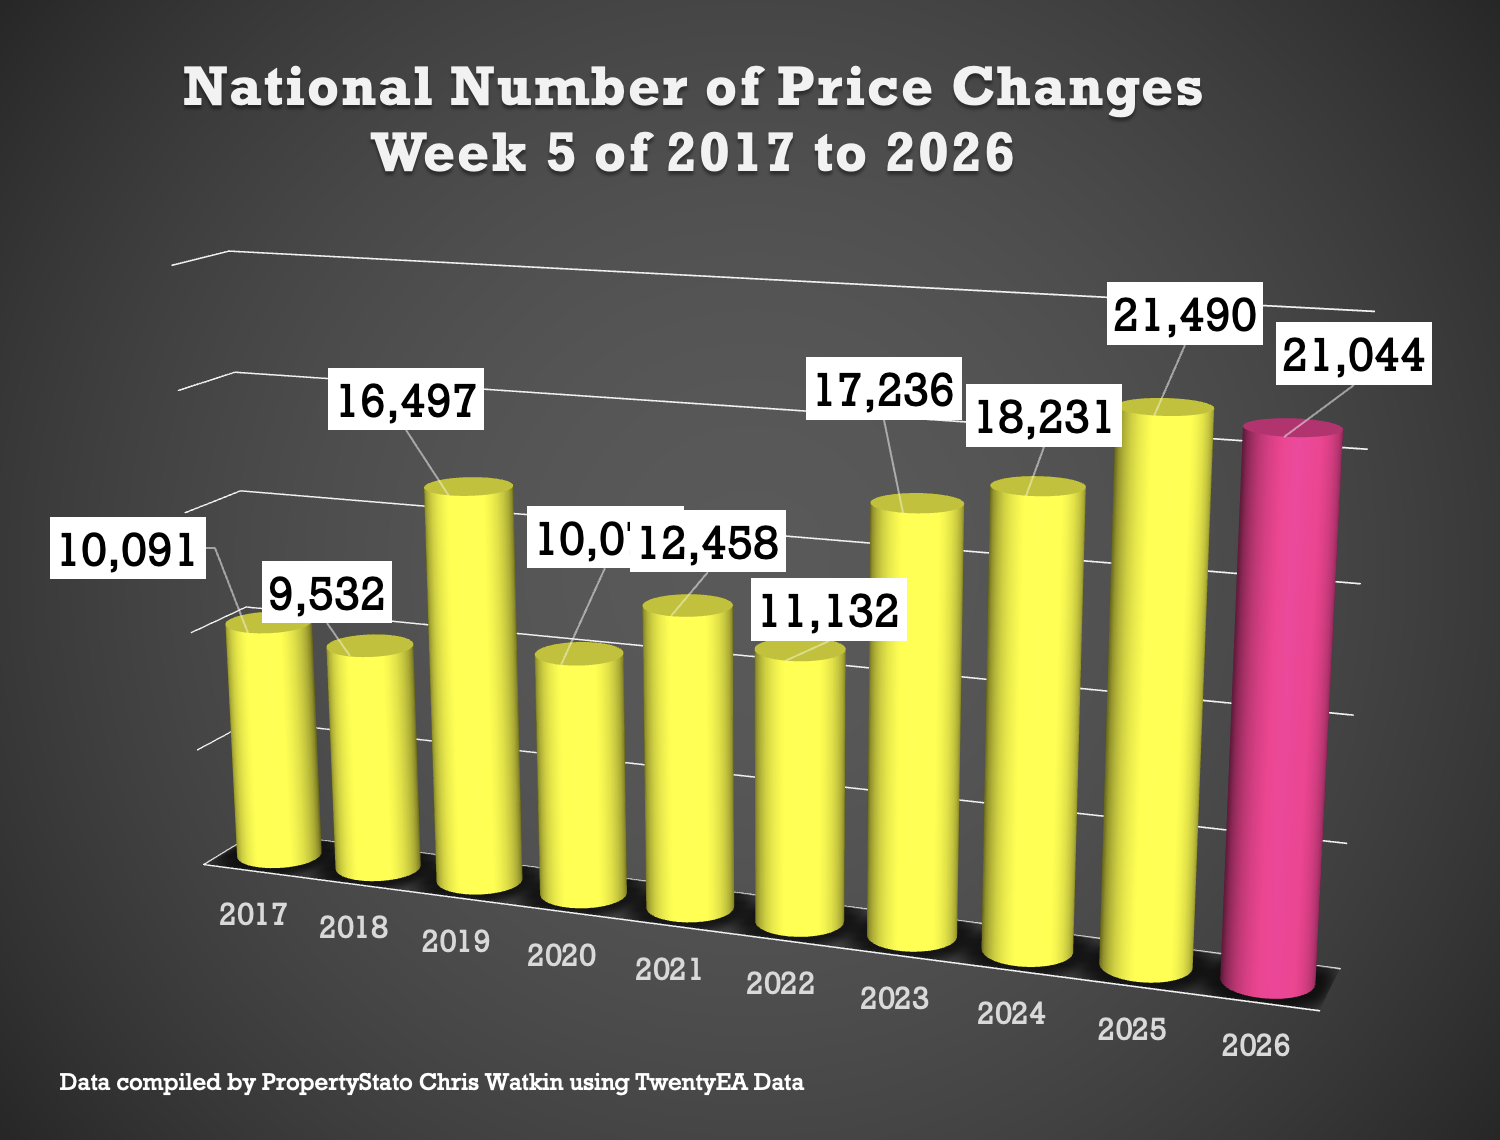
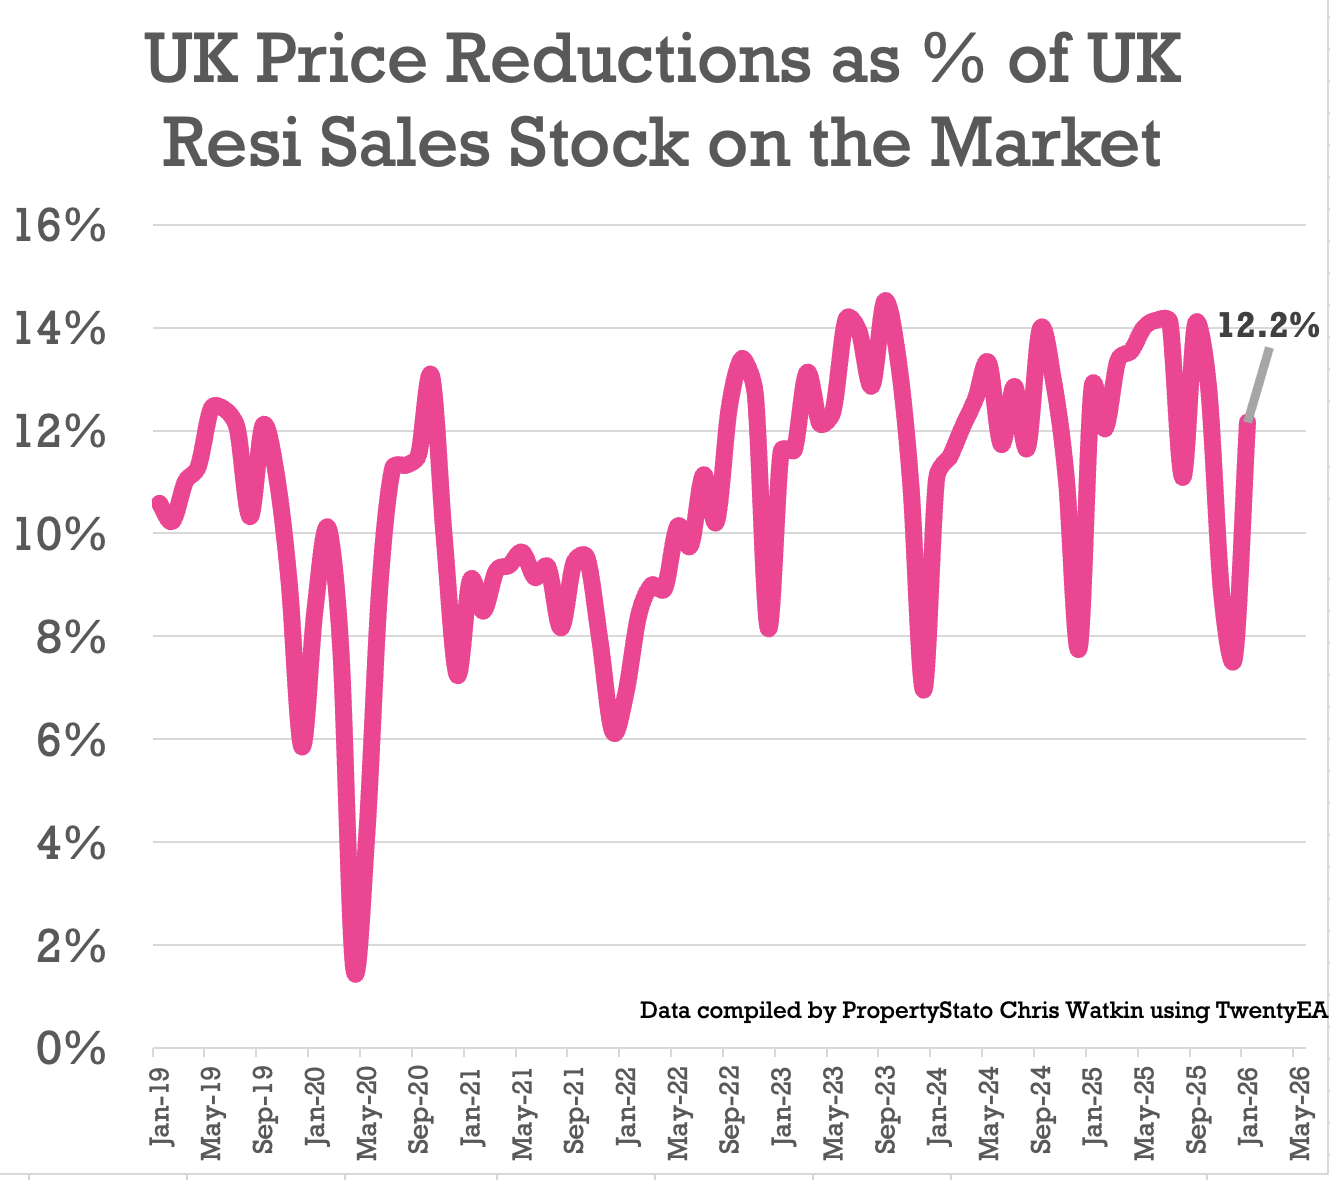
✅ Price Reductions
+ 21k reductions this week
+ 12.2% of resi homes for sale were reduced in January. Jan 25 – 12.8%. Jan 24 – 11.1%
+ 2025 average was 12.8%, versus the 5-year long-term average of 10.74%.
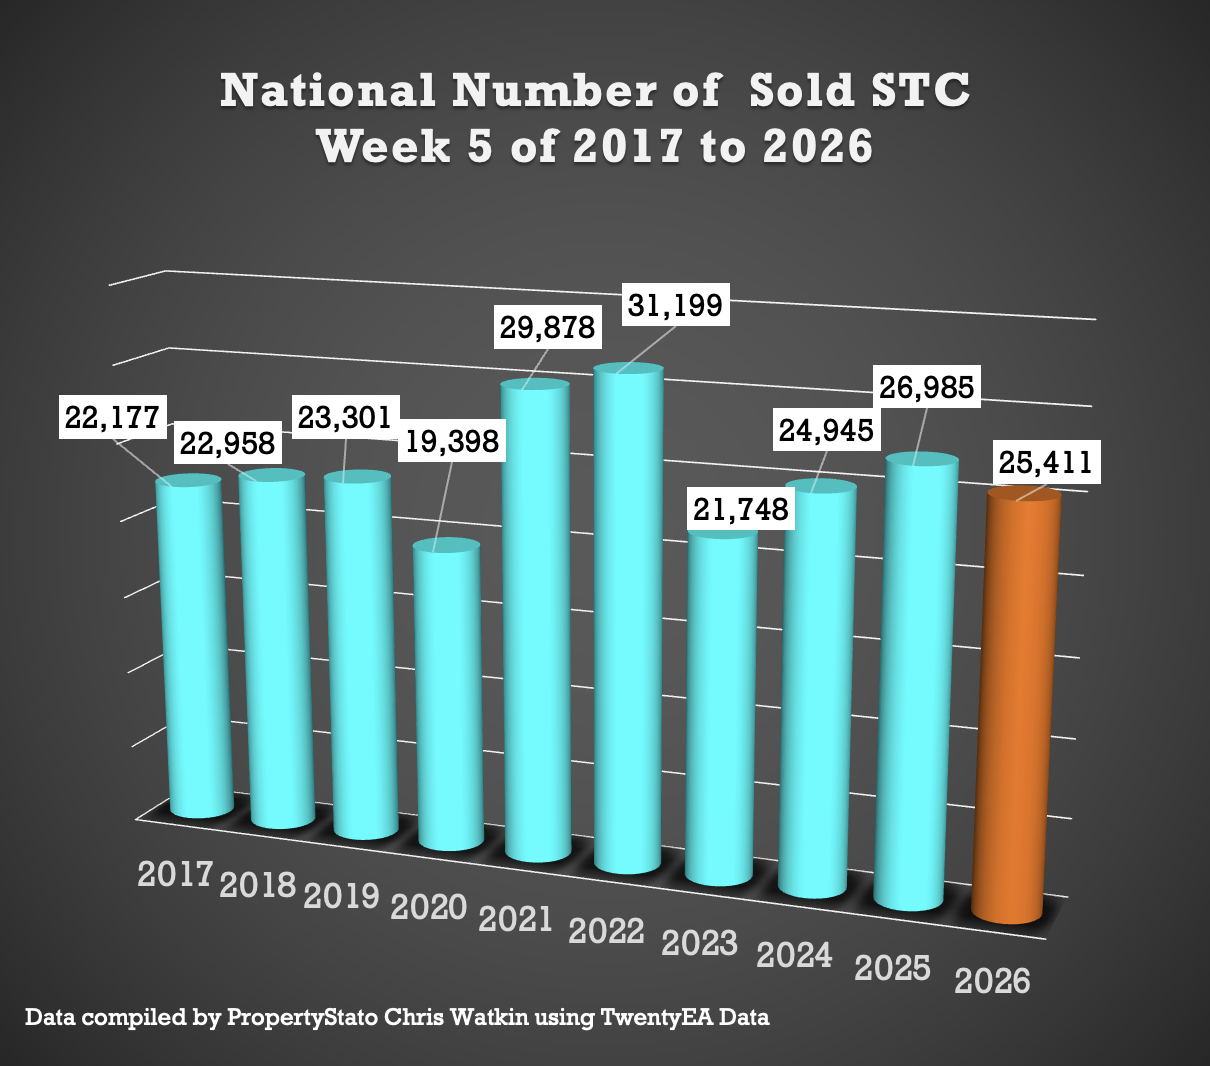
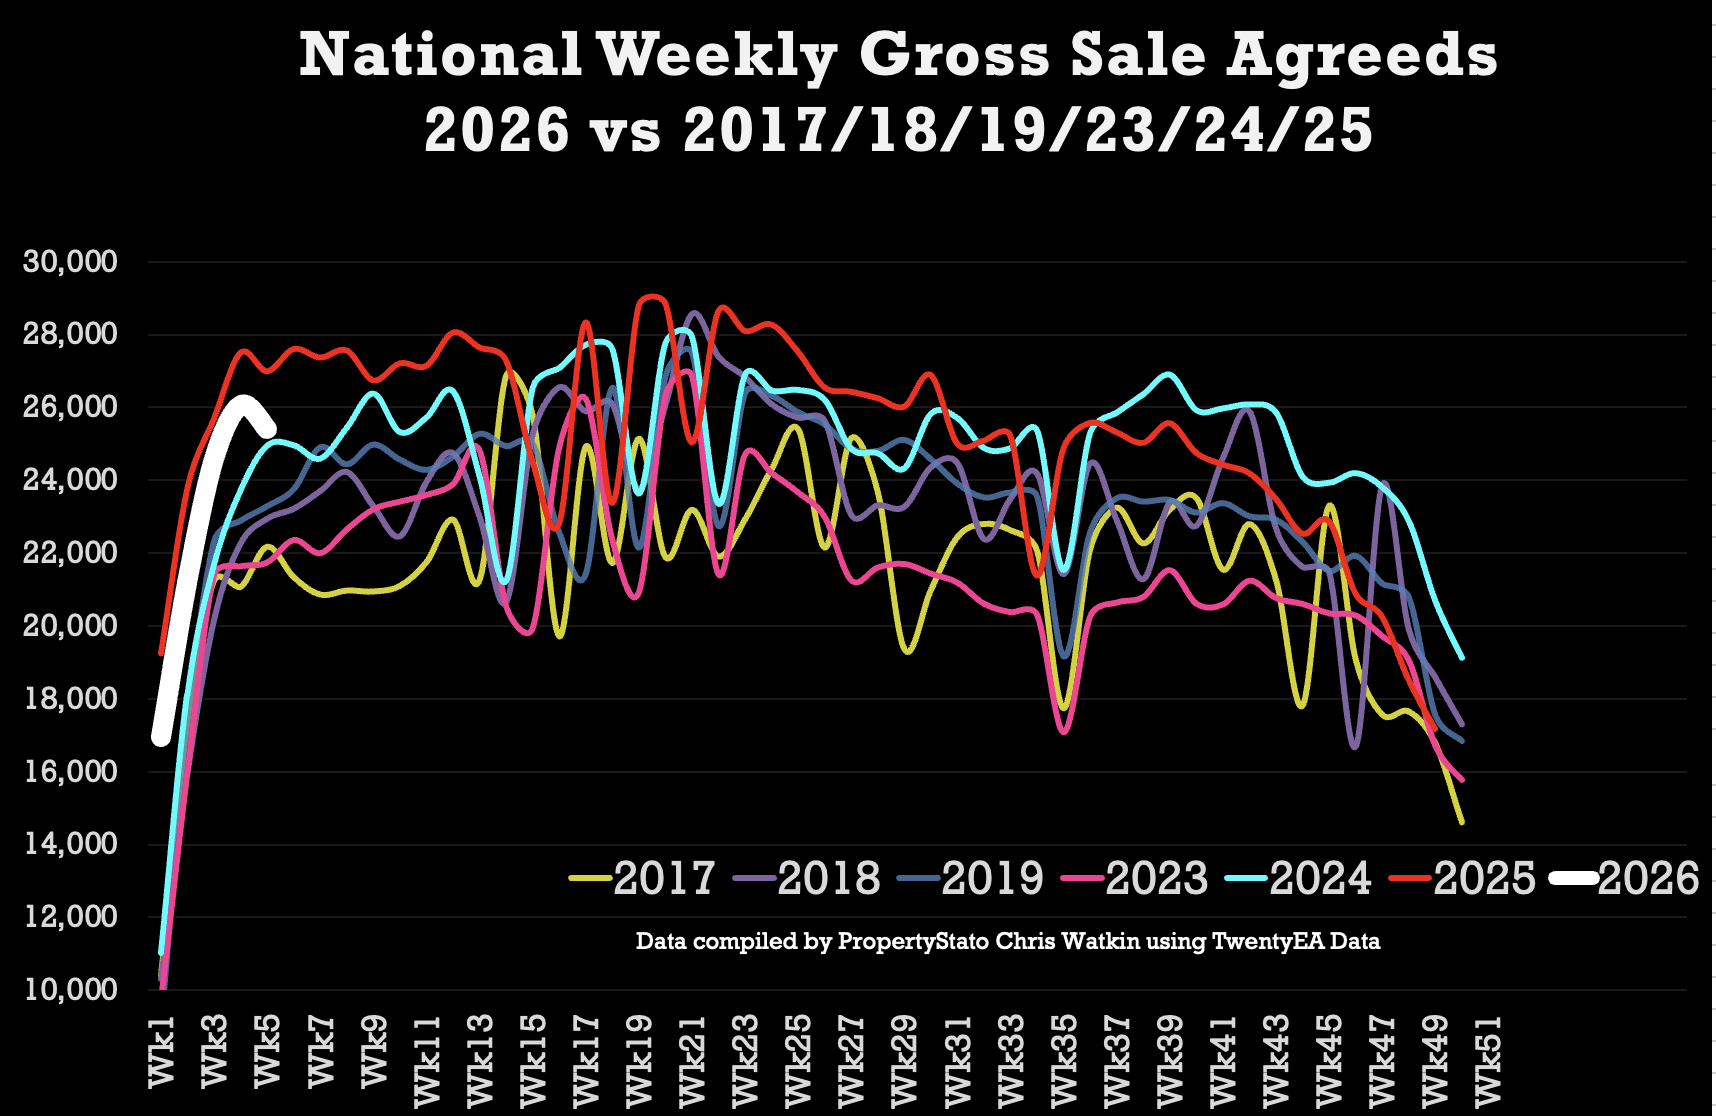
✅ Sales Agreed
+ 25.4k homes sold stc this week 5, slightly down as expected from 26k last week.
+ Week 5 average (for last 10 years) : 24.8k
+ 2026 weekly average : 22.2k.
✅ Price Difference between Listings & Sales
+ 19.7% difference (long term 10 year average is 16% to 17%). (£425k ave Listing Ave Asking price vs £366k Sale Agreed ave Asking price)
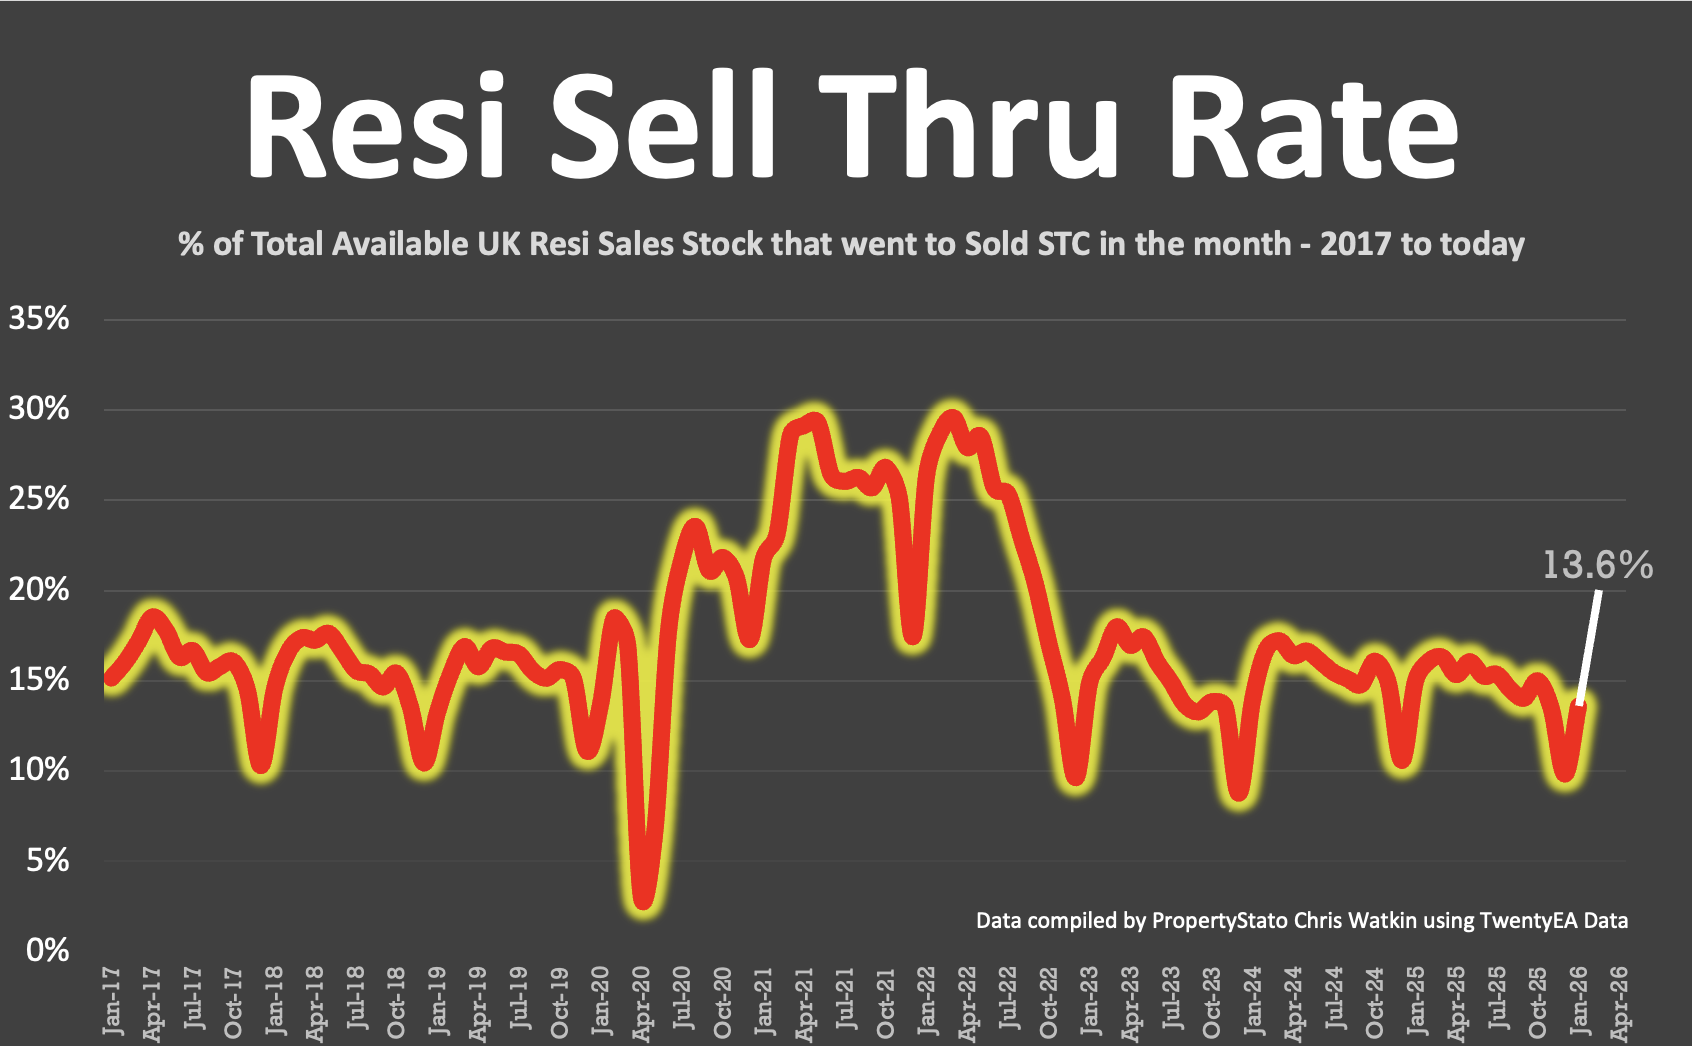
✅ Sell-Through Rate
+ 13.6% of homes on agents’ books went SSTC in January ’26. (Jan ’25 – 15% / Jan ’24 – 13.9%)
+ Pre-Covid average: 15.5%.
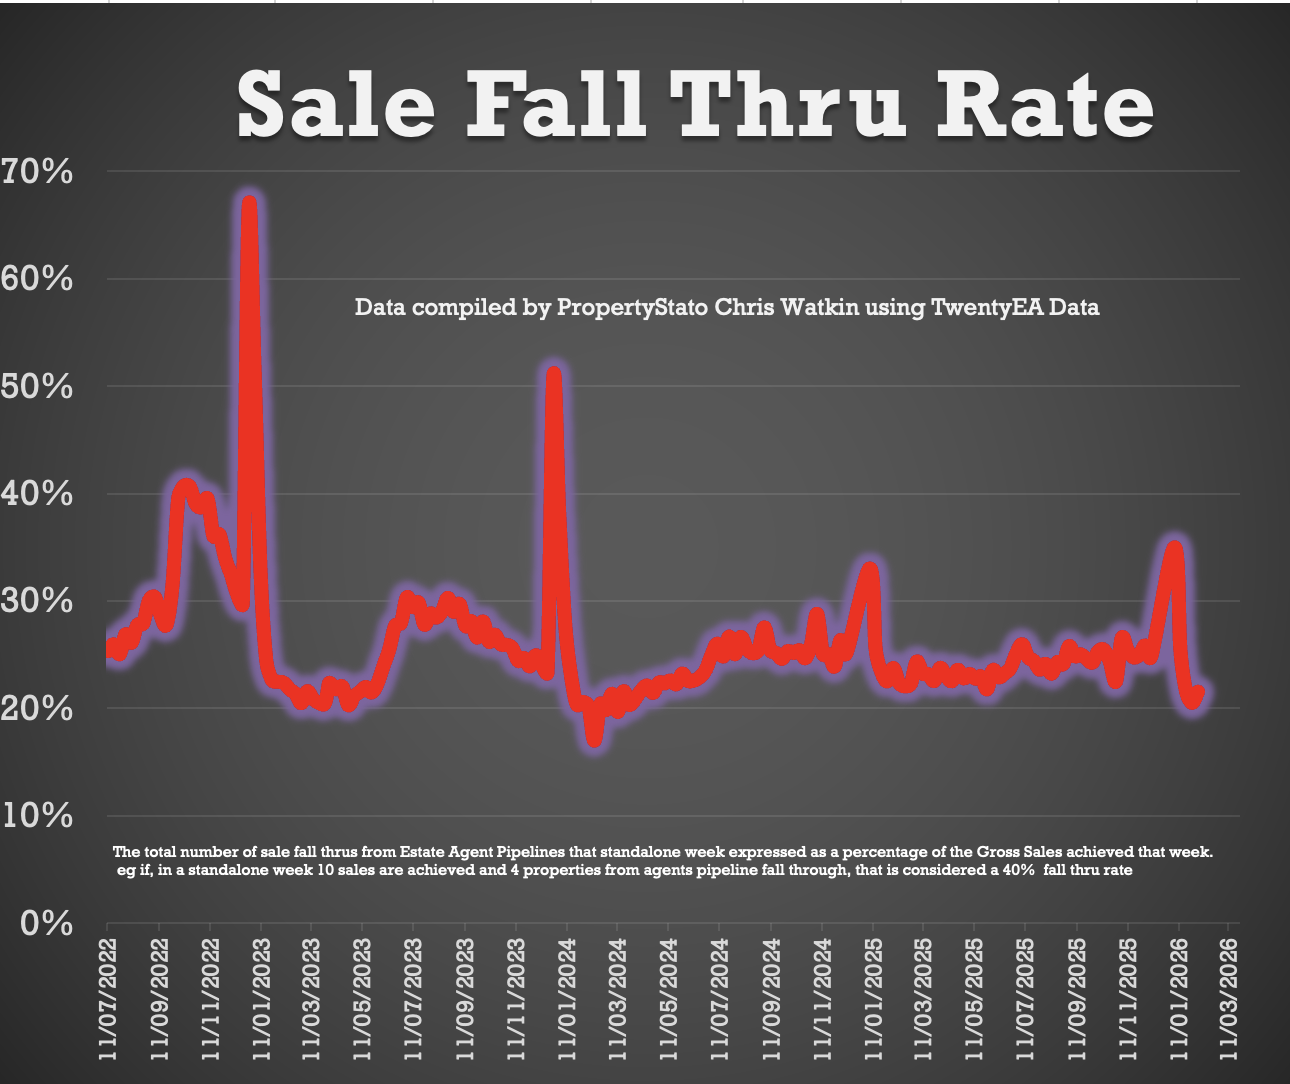
✅ Fall-Throughs
+ 5,468 fall-throughs last week (pipeline of 423k home Sold STC).
+ Weekly average for 2025: 6,100.
+ Fall-through rate: 21.5%, slightly up from 20.5% last week.
+ Long-term average: 24.2% (post-Truss chaos saw levels exceed 40%).
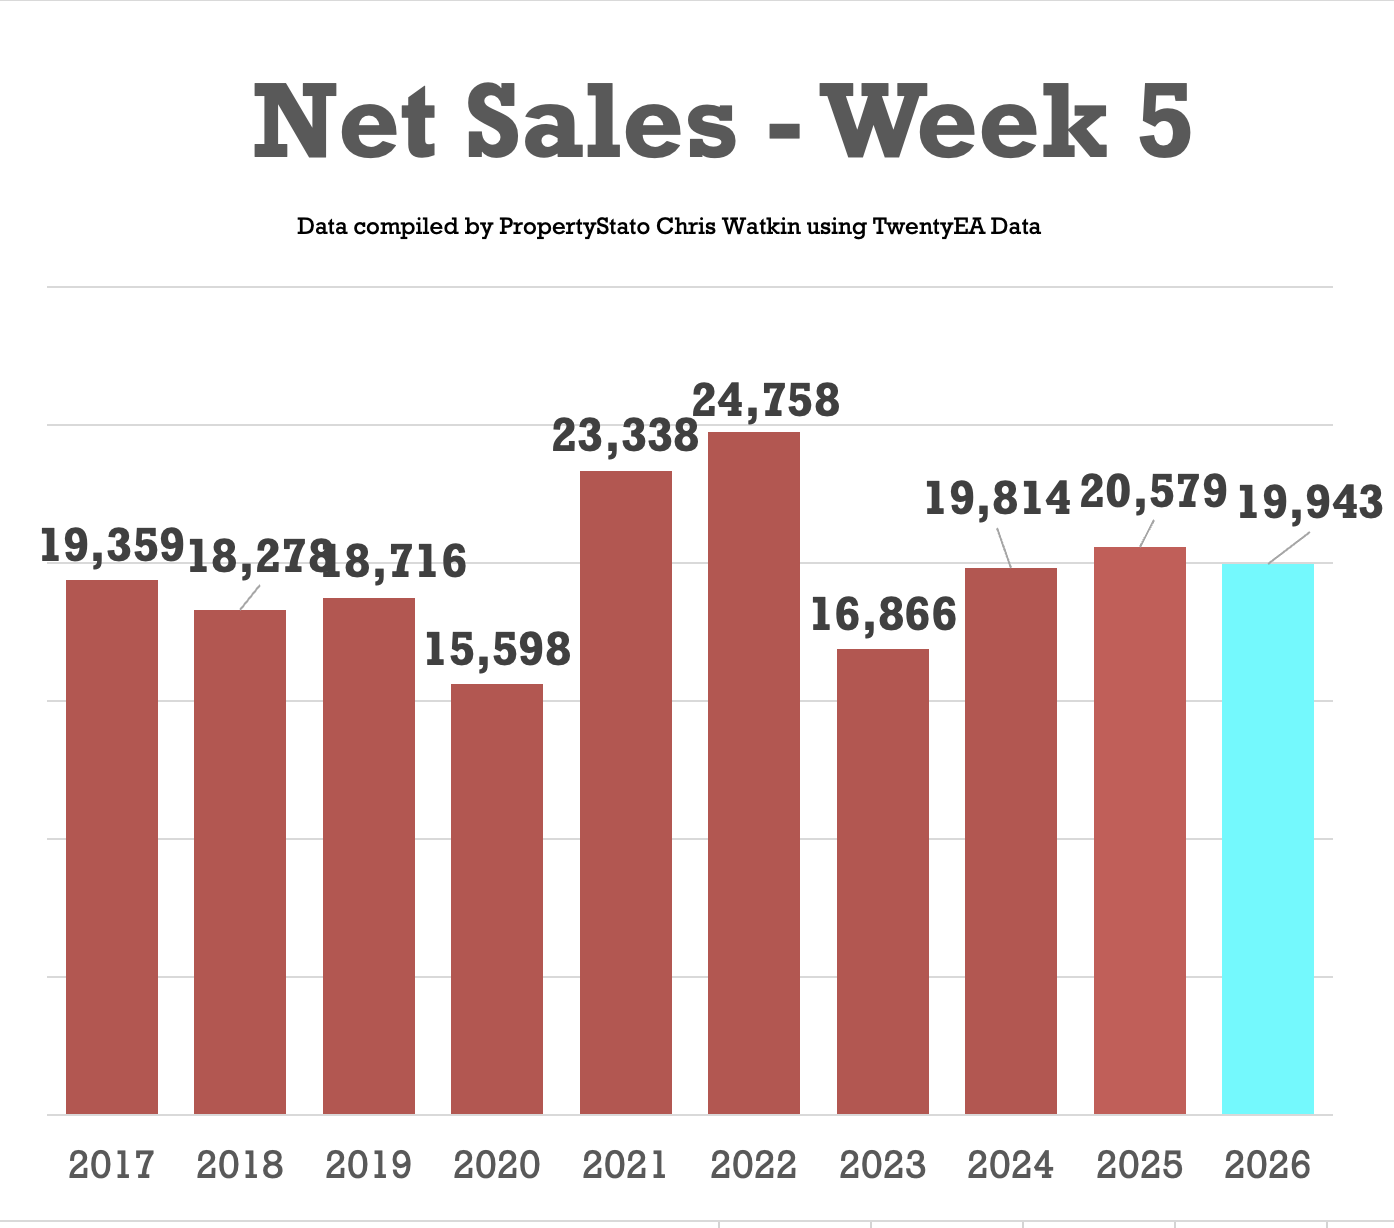
✅ Net Sales
+ 20k Net sales, down slightly from 20.7k last week
+ Ten-year Week 5 average: 19.7k.
+ Weekly average for 2026: 17.4k.
+ Weekly average for the whole of 2025: 19.2k.
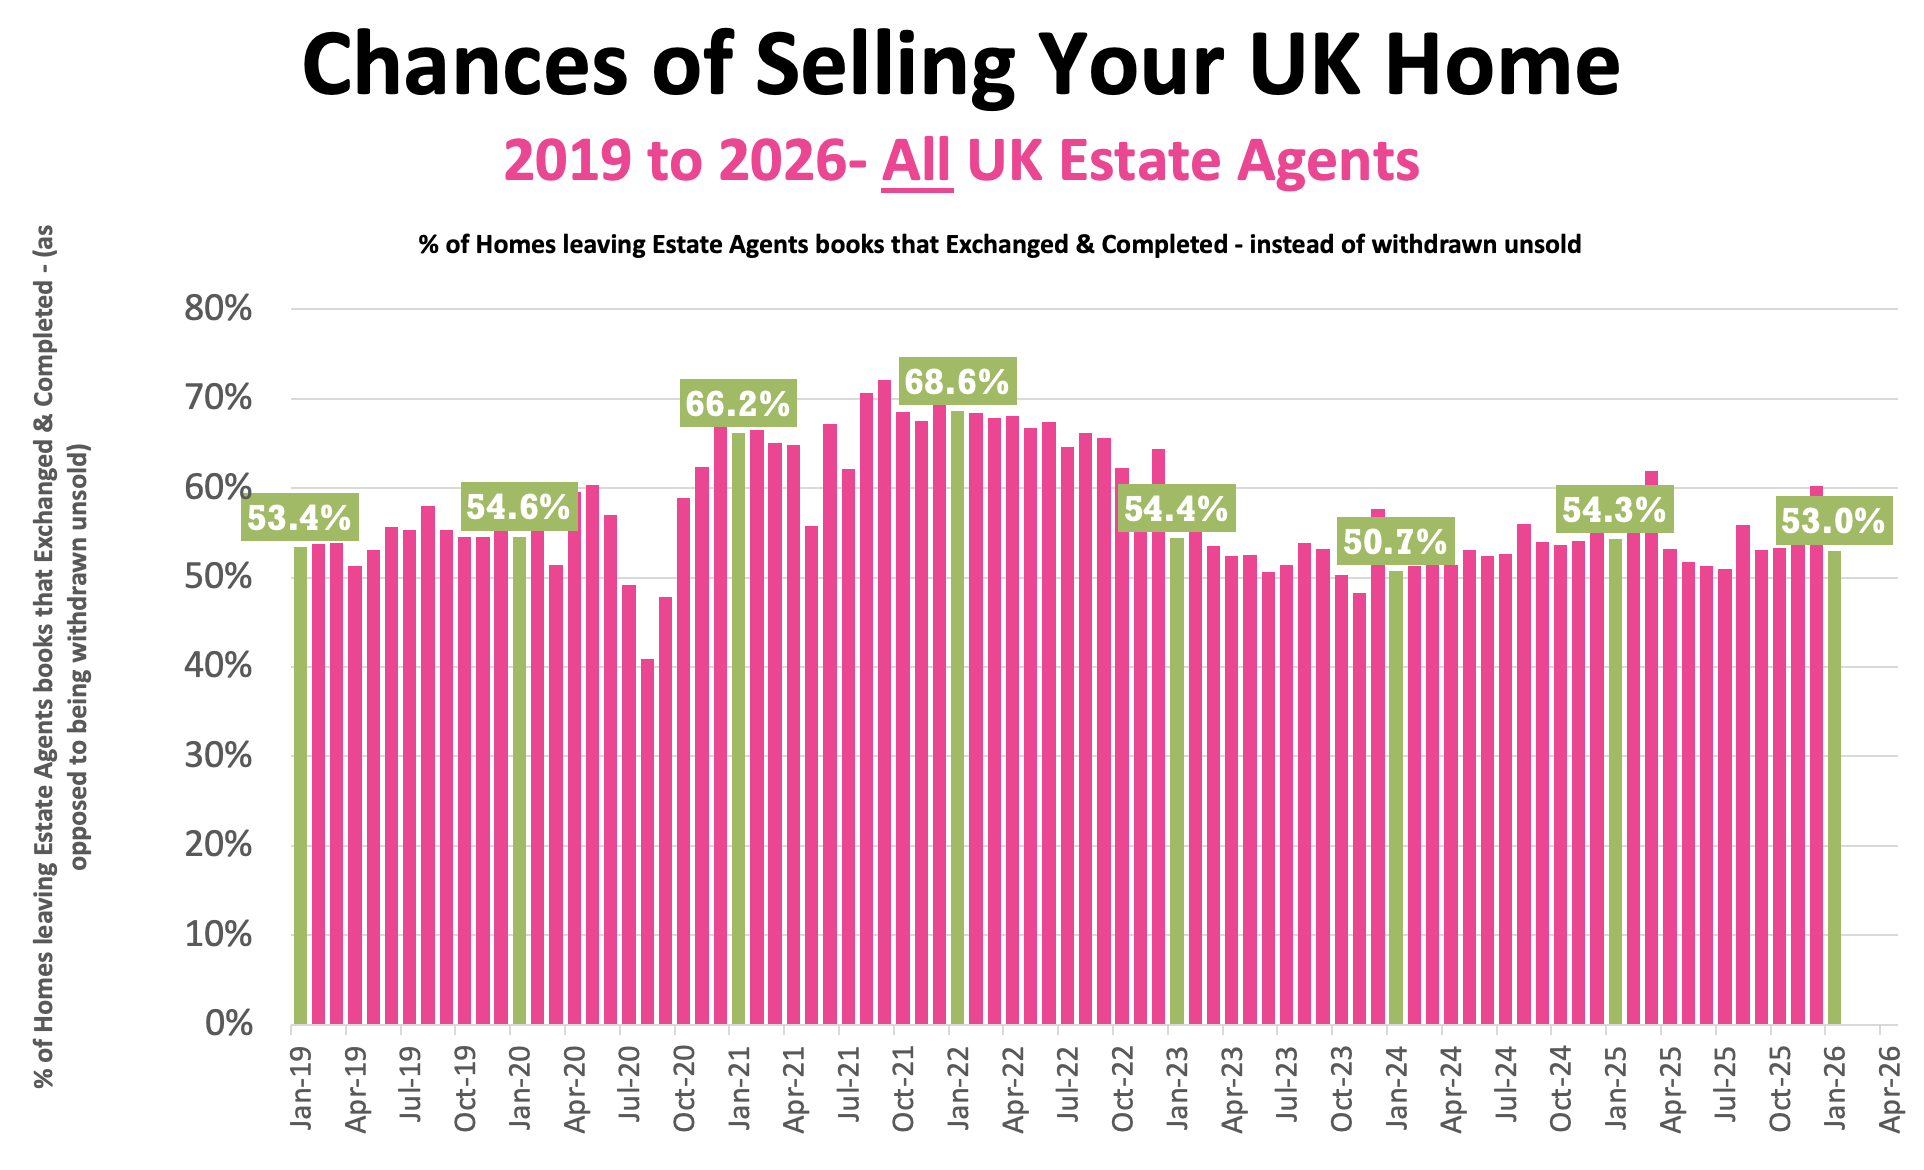
✅ Probability of Selling (% that Exchange vs withdrawal)
+ Jan ’26 Stats : 53% of homes that left agents’ books exchanged & completed in Jan. (Note this figure will change throughout the month as more Feb stats come in).
+ December 60.2% / November 55.2% / October 53.3% / September: 53.1% / August :55.8% / July: 50.9% / June: 51.3% / May: 51.7% / April: 53.2%.
+ Jan 25: 54.3% / Jan 24: 50.7% / Jan 23: 54.4% / Jan 22: 68.6%.
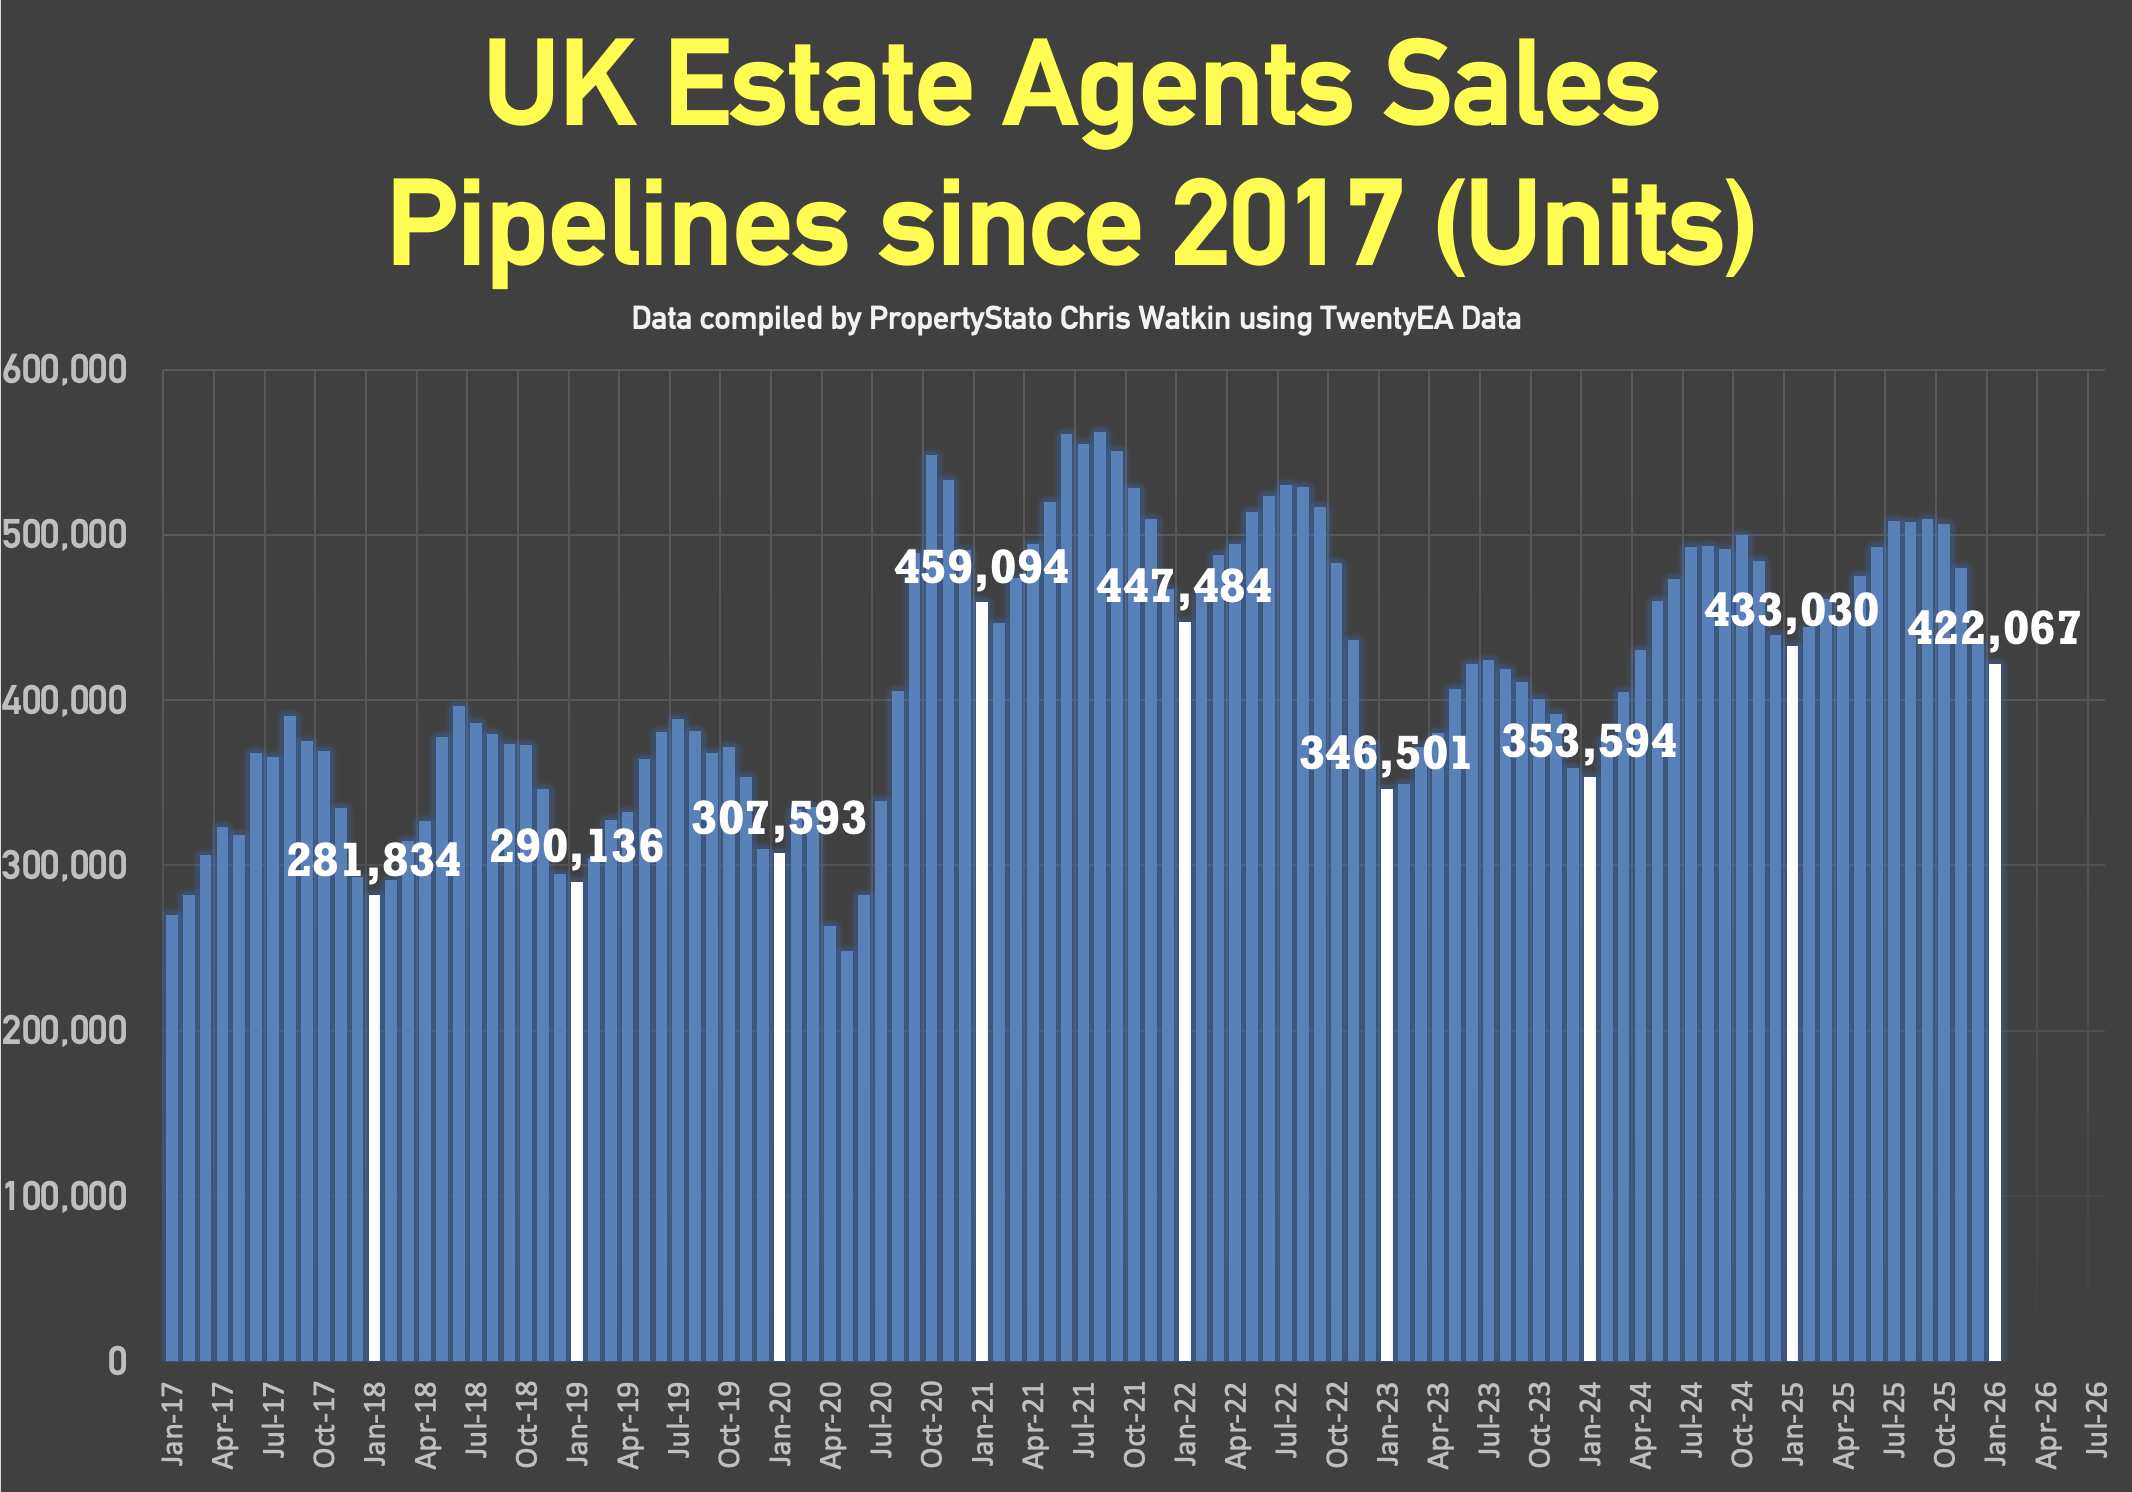
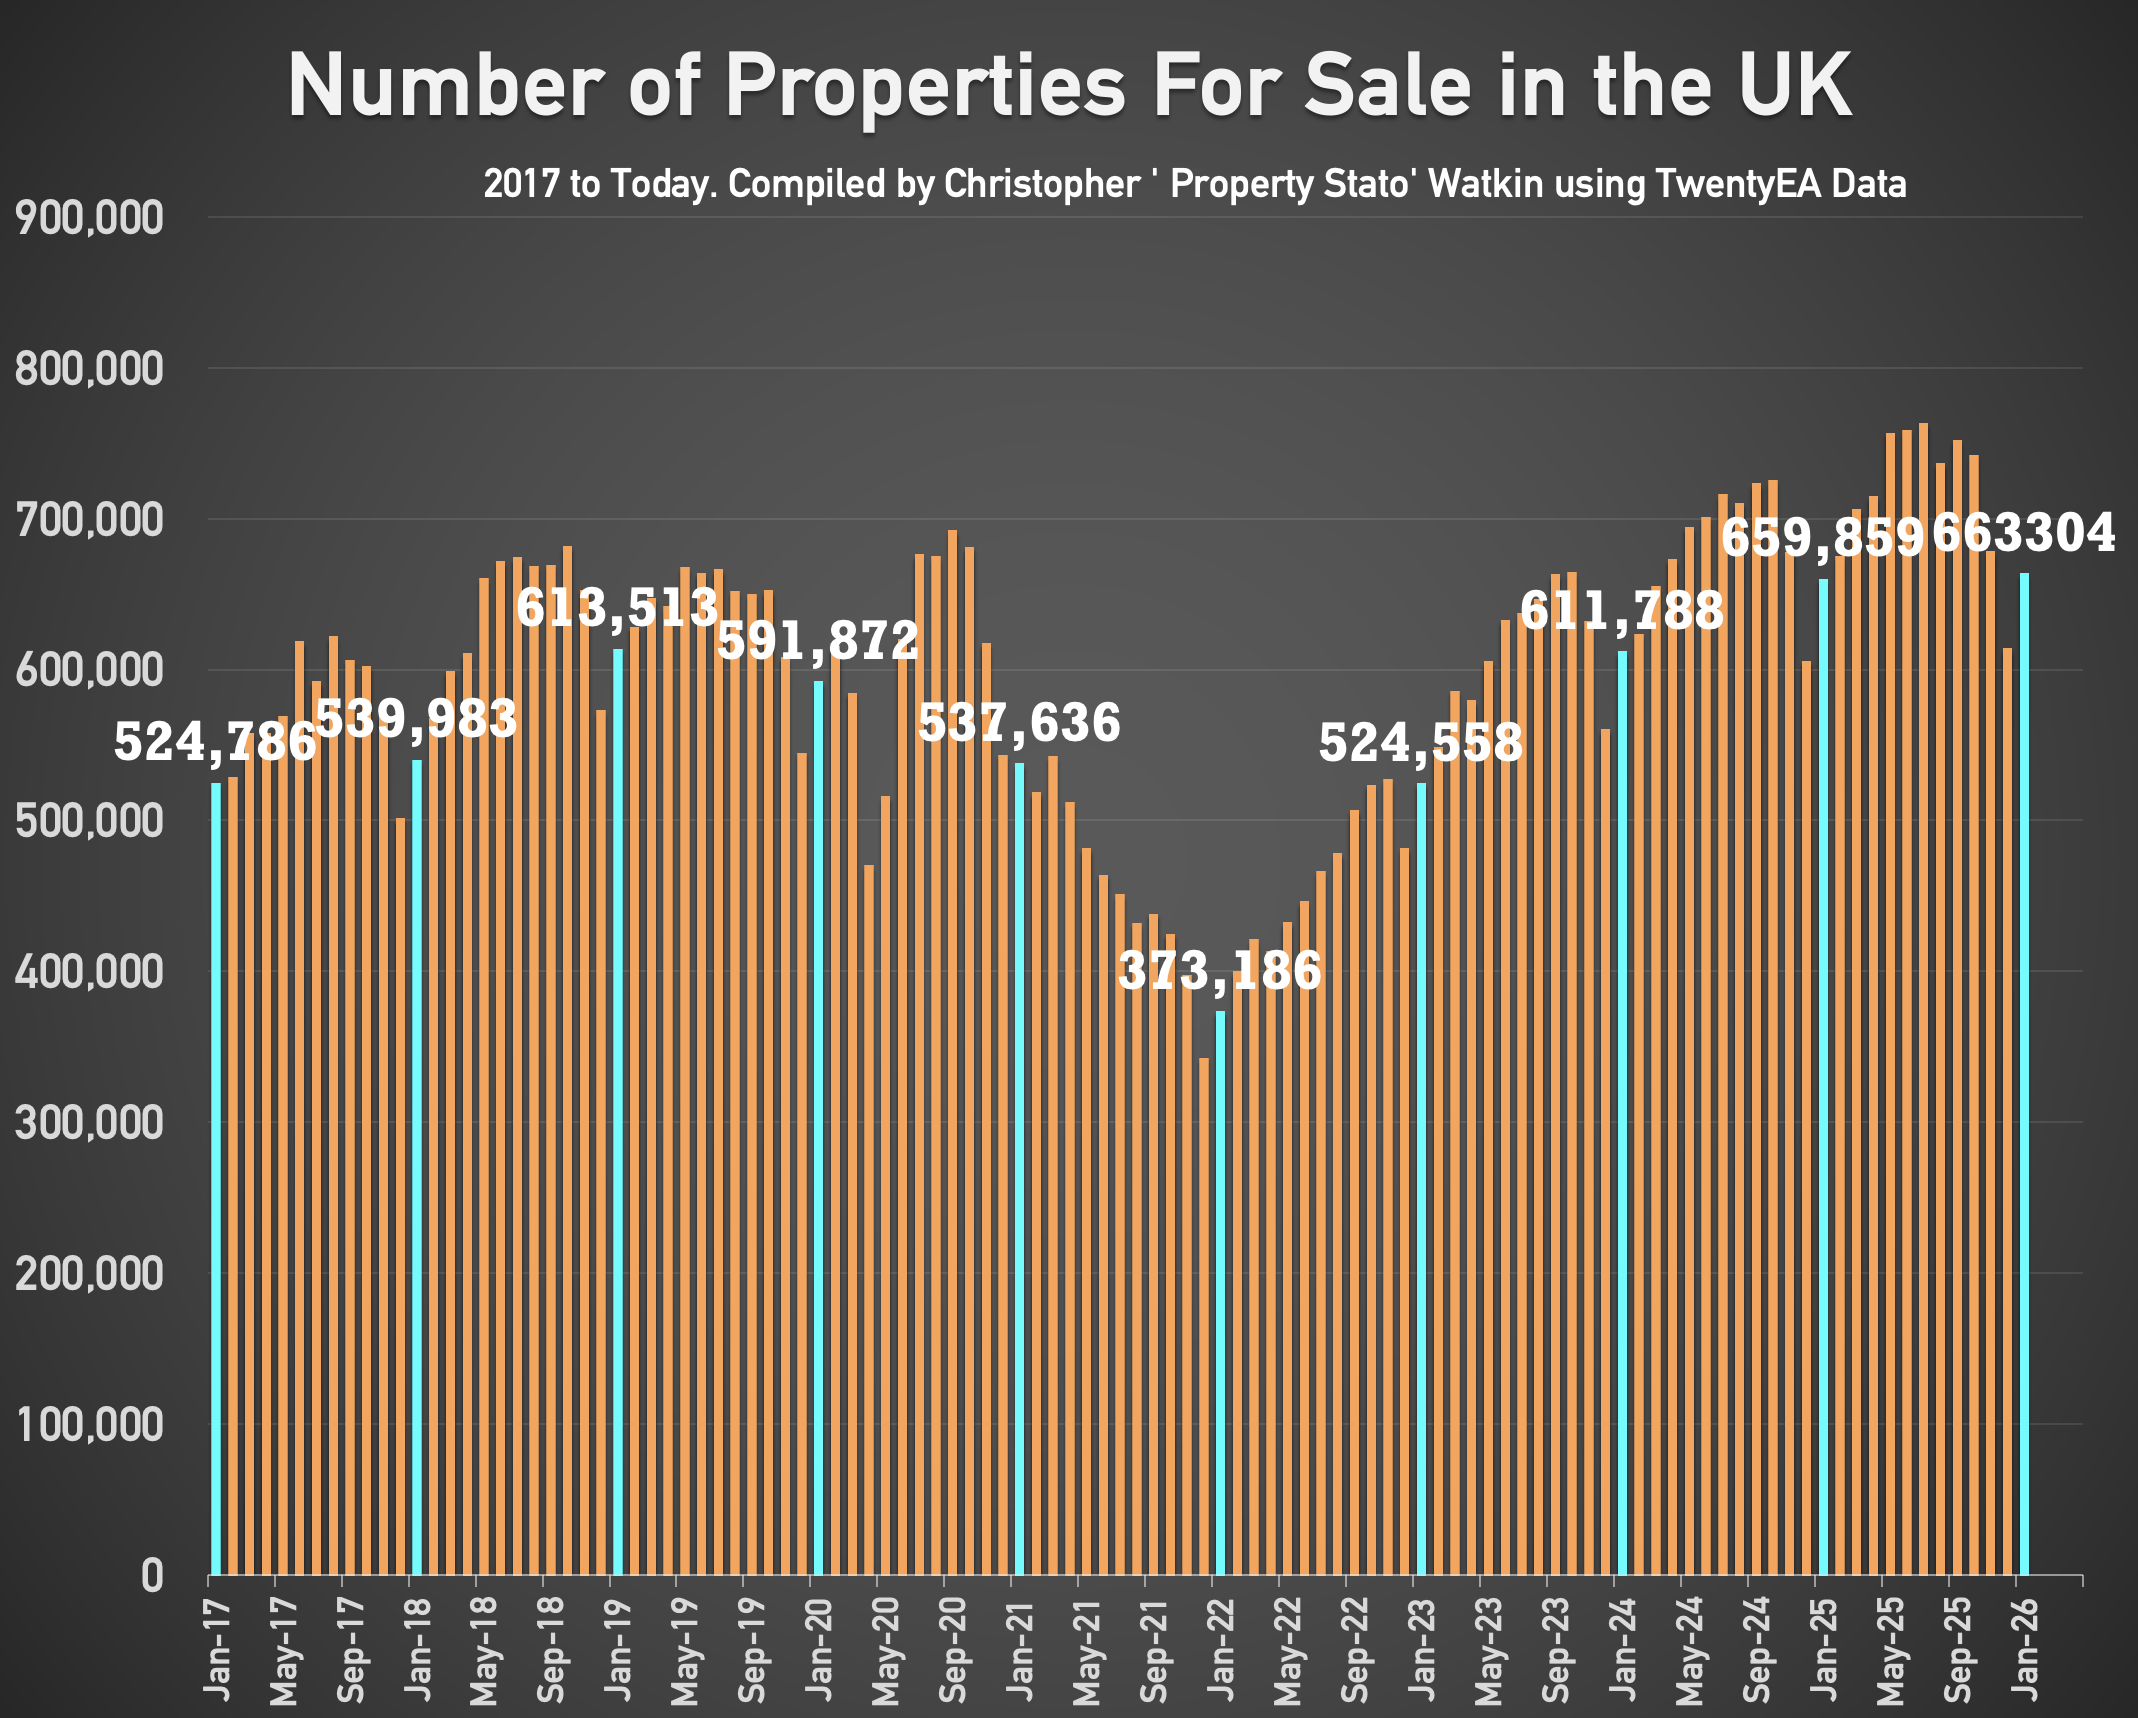
✅ Stock Levels
+ 663k homes on the market on the 1st of February ’26. (660k – Jan 25)
+ 422k homes in agent’s sales pipeline on the 1st Feb 2026, slightly lower than 12 months ago on 1st Feb ’25 (433k).
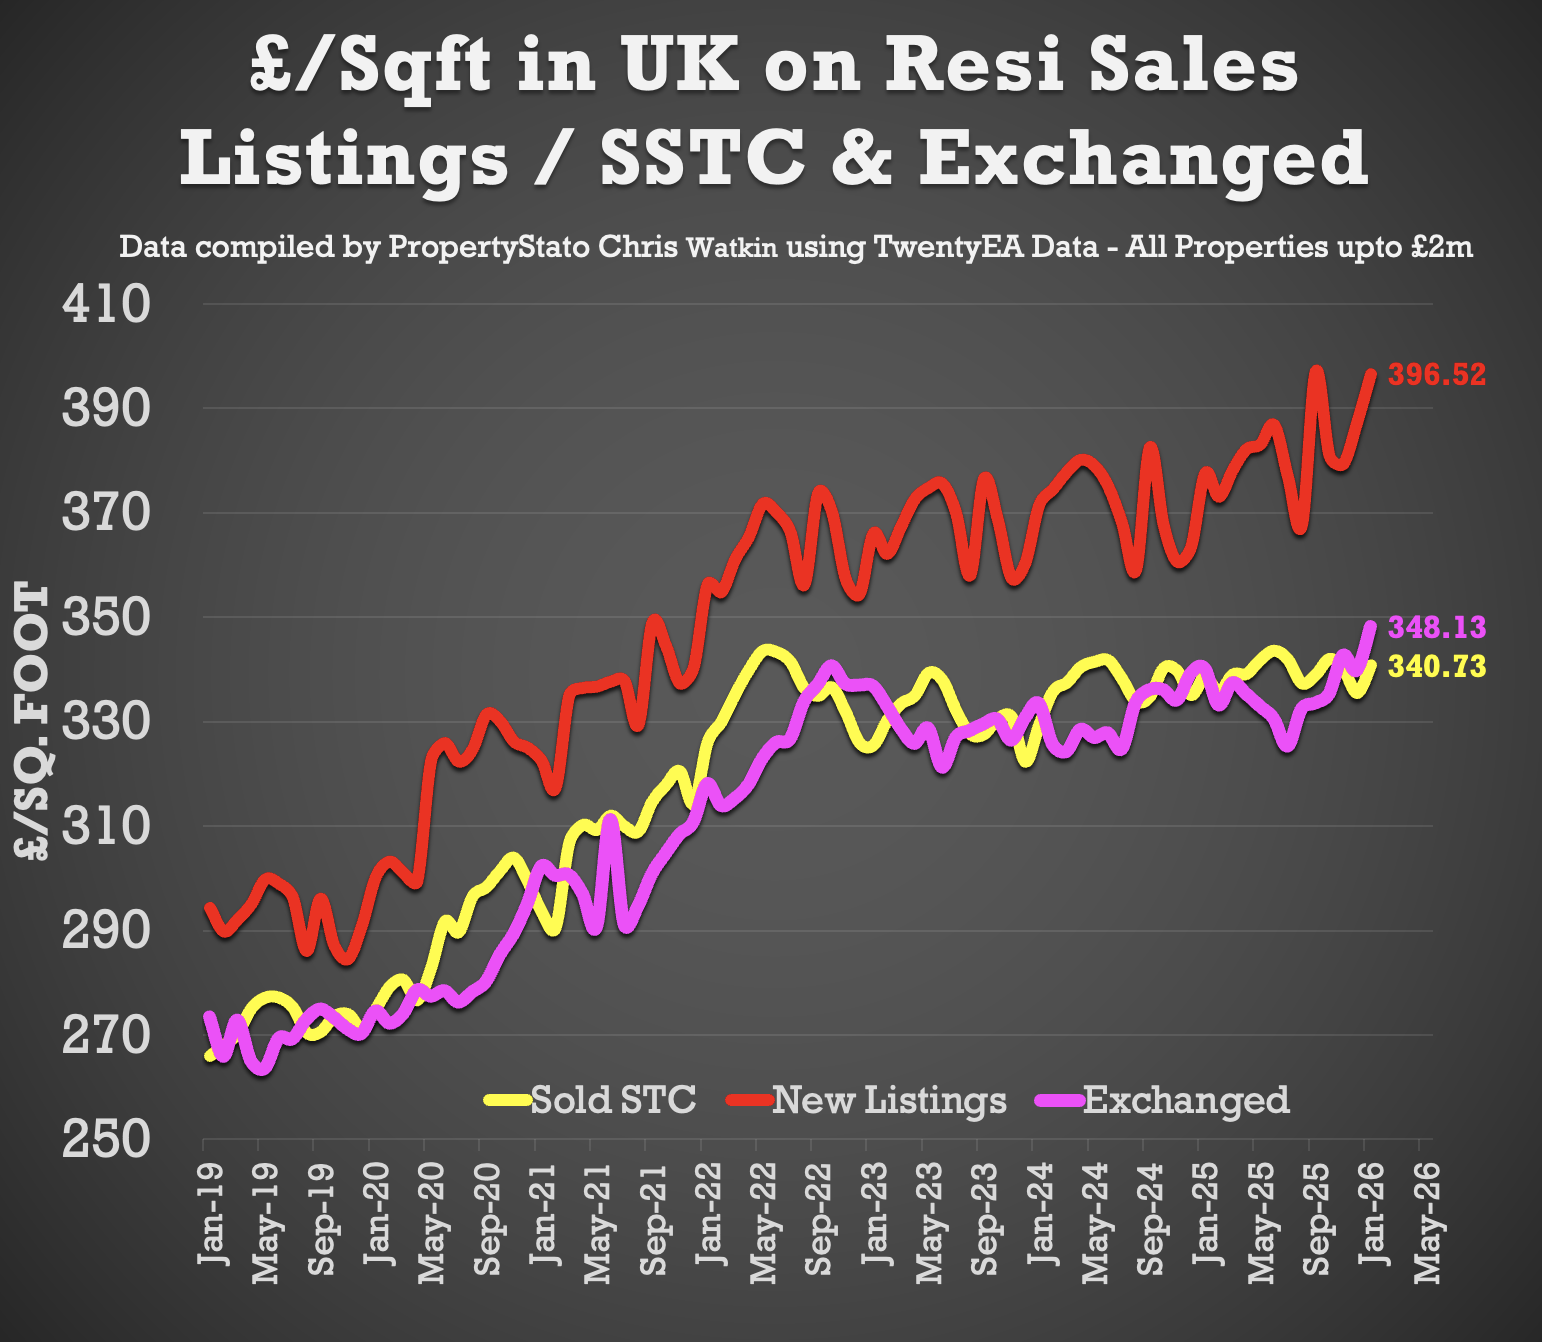
✅ House Prices (£/sq.ft)
+ January ’26 agreed sales averaged £340.73 per sq.ft. 0.63% higher than 12 months ago (£338.59) and 16% than 5 years ago (£293.54). The £/sqft at sale agreed matches the HM Land Registry Index with a 98% accuracy, 5 months in advance. That is why it is so important.